
As part of our mission at xlegant we try to stay ahead of changes coming your way and offer some thoughts on their relevance and uses. This week I'll introduce 14 new functions, next week I'll cover the recent upgrade of AFE. Then I expect to get back to my own custom functions and apps.
Excel "What's New"
As an Office Insider on Microsoft 365 I get early access to new features. The functions presented here are according to release notes for Office for Windows Desktop (Current Channel (Preview) builds), effective August 16, 2022, Version 2208 (Build 15601.20044). Whether you have them yet, or when you'll get them depends on your installation. You can and should check Help → What's New to keep up with changes.
Most new Excel features and functions aren't hard to learn and use. The help tells you how, but not why. There are many how's but only one why. The best answer to why is that there's no better way to meet the purpose. That means purpose comes first. Every sheet has a customer; every formula is a sentence in the conversation. Choice of words is important. There are many ways to say something, few good ways and one best way.
At last count there are 452 native functions. Many are esoteric, and many overlap. I estimate that I'll never use half, I actively use 30% and might use the other 20%. New ones come in releases, usually in one or two categories. My biggest blocks of "never use" functions are in Statistical, Financial and Engineering categories, where there's probably not a lot of new function development. Recent releases have focused on the Logical and Lookup & Reference categories. For example, LAMBDA and LET are Logical ; FILTER and SORT are Lookup & Reference.
What this means is that a release is like Christmas; the package might be for you or might be for someone else. You need to unwrap it to find out what it is and who it's for. You might be delighted, or you might be disappointed; if you ignore it you'll never know. I'm here to give a preview so you can see what you're getting or missing. The end purpose is to help you build skills to efficiently create spreadsheets that are structurally and aesthetically elegant.
Text Functions
There are three new text functions that split a text string based on a delimiter string: TEXTBEFORE, TEXTAFTER, and TEXTSPLIT. These are easy to learn but will be an occasional convenience at best. I will now compare them to the alternatives.
First, what comes to mind when you hear "delimited text"? Probably you think of .csv data files (comma-separated values) that you get from some data source to work with in Excel. Excel is good at reading such files, automatically separating the fields into columns. When you do have a manual splitting task to do, the "Text to Columns" wizard walks through it in three easy steps.
Now, in such a context the single column of delimited data has no value. In the process of splitting columns, it is normally overwritten by the first split column. There is no reason to go back to, to add or edit the delimited data once it is split. Therefore, there is no reason to use a formula to do the splitting. It's a one-time task. Let the wizard rule.
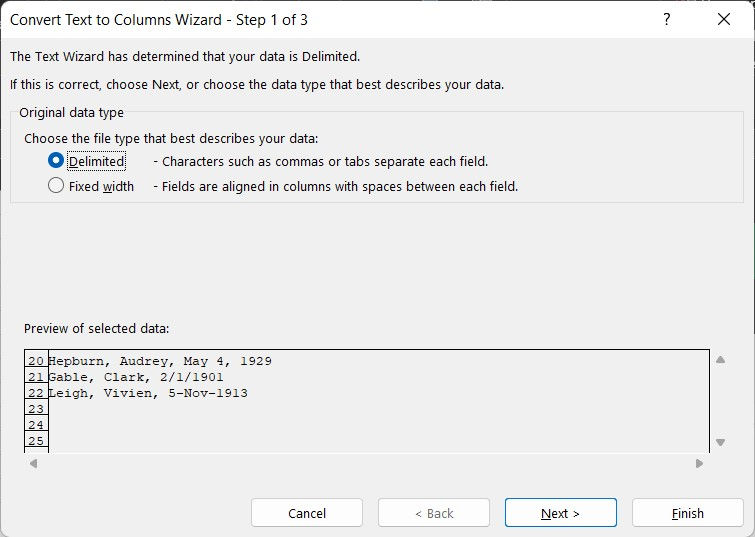
In order to properly evaluate the splitting methods, let's start with a quick review of the wizard. First, the wizard inspects the data column and returns a suggested method, either delimited or fixed width.
Next, for delimited, it asks what character(s) to use as delimiters. Here, with comma and space and "treat consecutive delimiters as one," extra spaces are removed, but additional columns are split that may not be desirable. The preview shows how the splitting will occur.

Finally, column formats can be set individually. The 'General' format automatically recognizes numbers and dates, and leaves everything else as text.

The TEXTSPLIT function dumbs down the wizard and requires retention of the delimited data column. The sample data set below has three cases of three delimited rows with three fields each: last name, first name, date of birth. The dates are inconsistently formatted for illustration. In case 1, the wizard separates based on any combination of "," and " ", as above. Audrey's birthdate is split to three columns, while Clark's and Vivien's are recognized as date values.

In case 2, the input data are semicolon-separated, and the space " " is not included in the wizard delimiters. Now all three rows split to three columns, but columns 2 and 3 contain a leading space, preventing date recognition.
Case 3 is once again csv with the new TEXTSPLIT function. Here, only the explicit delimiter string ", " is considered. Columns 2 and 3 no longer contain a leading space, however the dates are not recognized and are split as text. The result is a horizontal array. If there are any rows with an inconsistent number of delimiters, the arrays are of different size. Working with such arrays can be problematic, and the benefit is unclear.
Here are the three new text functions. TEXTBEFORE and TEXTAFTER replace nested-function methods, which adds some convenience for these rare needs.

To summarize, splitting data to columns is more like setting the table than serving a course. An ideal data model avoids such manipulations. When needed, the wizard does a good job. Think hard before cluttering up the sheet with text splitting functions and the useless delimited column required for them to work.
Cleanup Tip:
Columns resulting from the split often contain unnecessary and unwanted spaces. To quickly remove spaces from a range, select the range and hit Ctrl-H, Find and Replace. Enter a single space in "Find what" and leave "Replace with" empty, then hit "Replace All". If you only want to trim multiple consecutive spaces down to a single space, replace two spaces with one space, and repeat until none are found.
Array Functions
There are eleven new array functions that manipulate arrays in ways that are otherwise practically impossible: EXPAND, TAKE, DROP, VSTACK, HSTACK, CHOOSEROWS, CHOOSECOLS, TOROW, TOCOL, WRAPROWS, WRAPCOLS. This development has some promise, contingent on increasing adoption of arrays. I have previously put forward some uses for arrays, both constant and dynamic, and have incorporated arrays into numerous LAMBDA functions.
Dynamic arrays have been in Microsoft 365 since 2018. There are more than 20 functions that return arrays, and many more that accept array arguments. I believe that arrays are popular with experts, but that it will be some time before they are broadly understood and adopted by end users. One concern is that Tables and Arrays are not compatible. This deserves more attention to clarify appropriate uses for both. More to come, for now let's review array basics and see what these new functions add.
Array Basics
An array is a contiguous rectangular range of data, versus a range of cells.
The data can be defined as a constant, with special notation, e.g. ={1,2,3;4,5,6} where columns are separated by commas and rows by semicolons.
The data can be defined by formula, incorporating various array functions.
An array constant has fixed size; an array formula has dynamic size.
Arrays can be used internally within a formula to return an array or a single cell.
An array formula on a sheet is written only in the top left cell of the array.
An array is referenced by adding hashmark to the top left cell address.
If there are any data in the way of an array it will return a # SPILL! error.
Some Concerns
Array data clearly have something in common, but unlike tables, they have no headings to indicate what the columns mean, and no inherent connection to adjacent arrays. The onus is on the writer to explain or label the data appropriately.
Since they can be dynamic in size, formatting can be a challenge; conditional formatting can help.
Rules are implicit and self-governed. For example, don't try to combine arrays that are not compatible; don't leave arrays naked, explain them; position them to avoid spill errors and support the sheet purpose.
The release page groups these eleven functions into three categories; combining, shaping and resizing arrays.
Combining Arrays
VSTACK, HSTACK
There are two ways to combine arrays, vertically and horizontally, by VSTACK and HSTACK. I immediately found a use for this in my custom calendar function, to stack the 1-by-7 array of weekdays on top of the weeks-by-7 array of dates, eliminating the calheader function (I'll get back to that in a later post). We can similarly think of ways to label an array by stacking a row of text with the rows of data. By referencing constituent arrays, the identity of the data set is retained for manipulation as needed.

The risk of stacking arrays is there's no check of compatibility. You can end up with a monster array that makes no sense. The input arrays can be different data types and dimensions; any empty cells are filled with # N/A. For example, VSTACK of a 1-by-7 array and a 7-by-1 array returns an 8-by-7 nonsense array with 42 # N/A cells.
Probably some other uses will come up, and as long as risks are avoided these can be useful tools.
Shaping Arrays
TOROW, TOCOL, WRAPROWS, WRAPCOLS
These are two pairs of functions that are inverse of each other. The "TO" functions convert a 2D array to 1D; the "WRAP" functions convert 1D to 2D. On the left is a 2-week calendar, which internally returns a 2-by-7 array, converted to a single column by TOCOL. On the right is that single column converted back to 7 columns by WRAPROWS.

If the number of array elements is not a multiple of the wrap number, some cells are filled with # N/A by default, unless a [pad_with] argument is entered.

As evident, there's again risk of doing something here that makes no sense; self-governance is necessary.
Resizing Arrays
TAKE, DROP, CHOOSEROWS, CHOOSECOLS, EXPAND
TAKE returns a portion of the array as the specified number of rows and columns. Positive numbers are taken from top and left, negative numbers are taken from the bottom and right. DROP returns what's left after subtracting rows and columns.
In this example, I've combined three functions to shift the array above it. TAKE returns the right column (-1); DROP removes the same column (-1) and returns the other six columns; HSTACK combines them.

You can DROP 0 rows or leave the rows argument blank to drop full columns. You can't TAKE 0 rows, but you can leave it blank to take full columns. TAKE and DROP will have some value in special cases like this, since they resize the array while maintaining order.
CHOOSEROWS and CHOOSECOLS simply return select rows or columns as specified by index numbers (e.g. 1,2,5...). EXPAND increases the size of the array, filling cells with # N/A or an input value. For now, I can't think of any reason to be interested in these.
Conclusion
Whatever I adopt will show up down the road as I present more custom functions. Hopefully this kind of presentation will help you reach your own adoption threshold without wasting time or missing out, or at least steer your curiosity in a fruitful direction. Until next time, peace.
Comments